Report(e): In these elections, economy rules the vote

 In very few elections will the economy be so present in the minds of Puerto Rico voters as in the one coming up Nov. 6. After six years of economic downturn, it seems that the worst may be behind us, but the truth is that we are threatened by the possibility of a new recession (“Double-dip recession.”)
Less than 10 days away from the general elections, News is my Business and Sin Comillas, two digital newspapers specialized in business news, seek to contribute to the transparency of information through this Report(e), in which we present a synopsis of the main economic statistics published by the government.
Our intention is to facilitate their unbiased analysis, providing a brief explanation of the data to allow you to interpret Puerto Rico’s economic reality of the past eight years, to face what’s ahead.
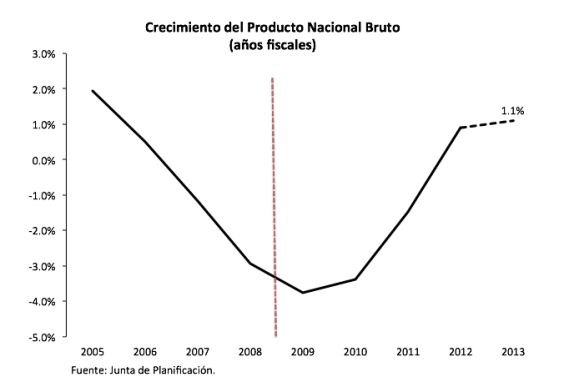
Gross National Product:
- In 2005, the economy grew 1.9%
- In 2009, it shrank 3.8%, reaching its lowest point in this recession
- In 2012, it grew 0.9%
- It is estimated there will be a 1.1% growth in 2013
Economic Activity Index:
Shows that the economy pulled out of the recession early this year. This statistic, which is an indicator of economic trends, has been in positive territory after experimenting drops since 2006.
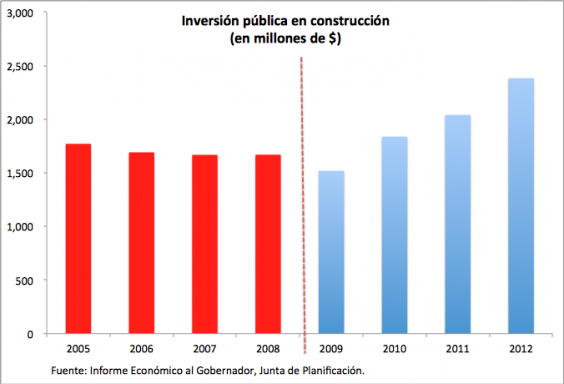
Public investment:
- After almost four years of reductions in public infrastructure project investments, from 2009 to 2012 investment increased by 14.4%, largely due to the injection of American Recovery and Reinvestment Act funds by the federal government.
- The total investment in the last four years amounts to $7.8 billion compared to $6.8 billion invested between 2005 and 2008.
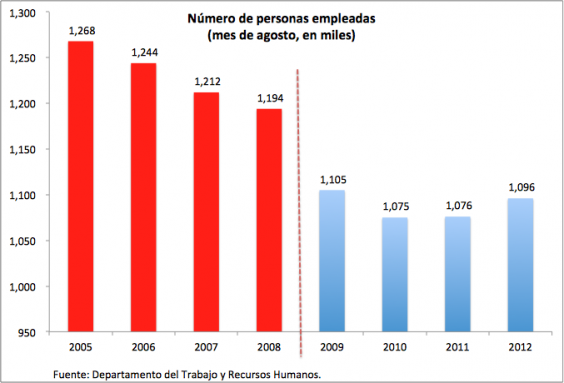
Number of employed people:
- In the last four years, 9,000 jobs have been lost. When comparing job numbers from August 2012 and August 2005, 172,000 jobs have been lost.
- In the last 12 months, the number of people employed increased by 20,000.
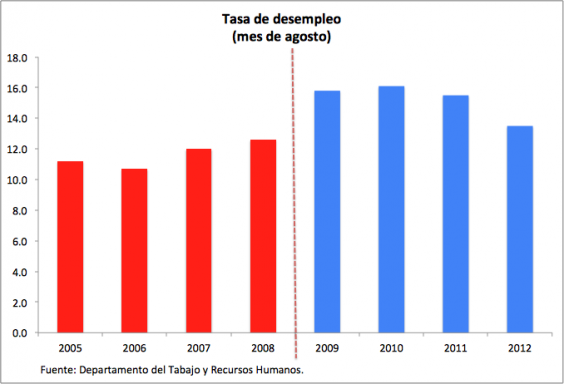
Unemployment rate:
- The unemployment rate reached a historic high of 16.1% in 2010.
- In the last two years, this number has dropped to 13.5% in 2012.
- In 2005, the unemployment rate was 11.2%
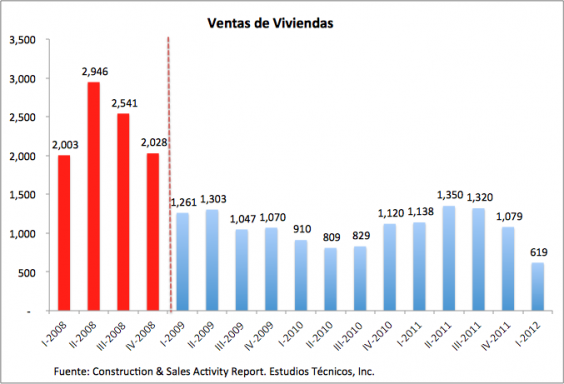
Housing sales:
- As of 2009, the housing market collapsed due to the financial crisis and excess inventory.
- The Housing Stimulus plan helped avoid a bigger collapse.
- Home sales are virtually half in 2012, vs. 2008.
Cement Sales:
- Cement sales have been consistently dropping over the past eight years.
- Cement sales have dropped by 29% in the past four years and by 67% in the last eight years.
Government collections:
- Collections grew 12% in the last four years and are 4% higher this year vs. 2005’s total.
- The growth is due to Law 154, which has generated $2.56 billion. Without that revenue, the government would have collected 9% less and in the last year would have been 12% below 2008’s numbers.
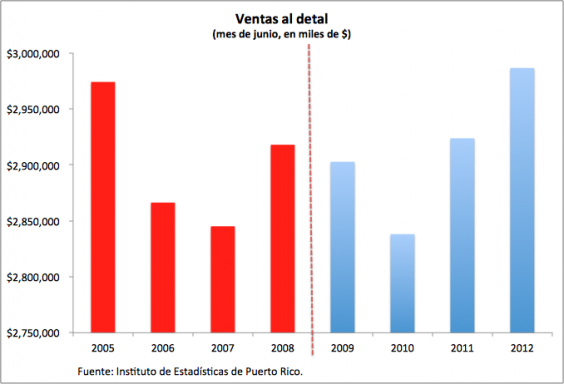
Retail sales:
- At the start of the recession, retail sales fell and then recovered slightly due to ARRA funds.
- During the peak of the recession, between 2009 and 2010, sales dropped 2%.
- Retail sales are up 2.2% in the past 12 months.
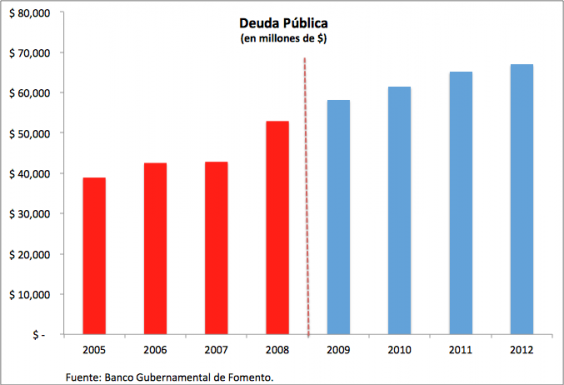
Public Debt:
- Public debt has reached a historically high level at $67 billion.
- The rate of indebtedness has been lower in the past four years, vs. 2005 through 2008. From 2009-2012, public debt increased by 15%, while from 2005 to 2008 it jumped 36%.
** These graphs and information are available for publication, as long as printed and/or broadcast reports provide full credit and attribution to both digital news outlets: News is my Business (www.newsimybusiness.com) and Sin Comillas (www.sincomillas.com.)






Excelente informacion Michelle y Luisa. La estoy compartiendo cin clientes dentro y fuera de PR. Gracias!!!
Excellent report. This report shows in a simple but clearly way
how the economy performed in the last years and how we get into the
recession. When I ran the Index of
Coincident Indicators last month, I noticed that the recession ends in the
third quarter of 2011.
Congratulations
to Michelle and Luisa.
Angel Rivera